Value stream mapping from your layout.
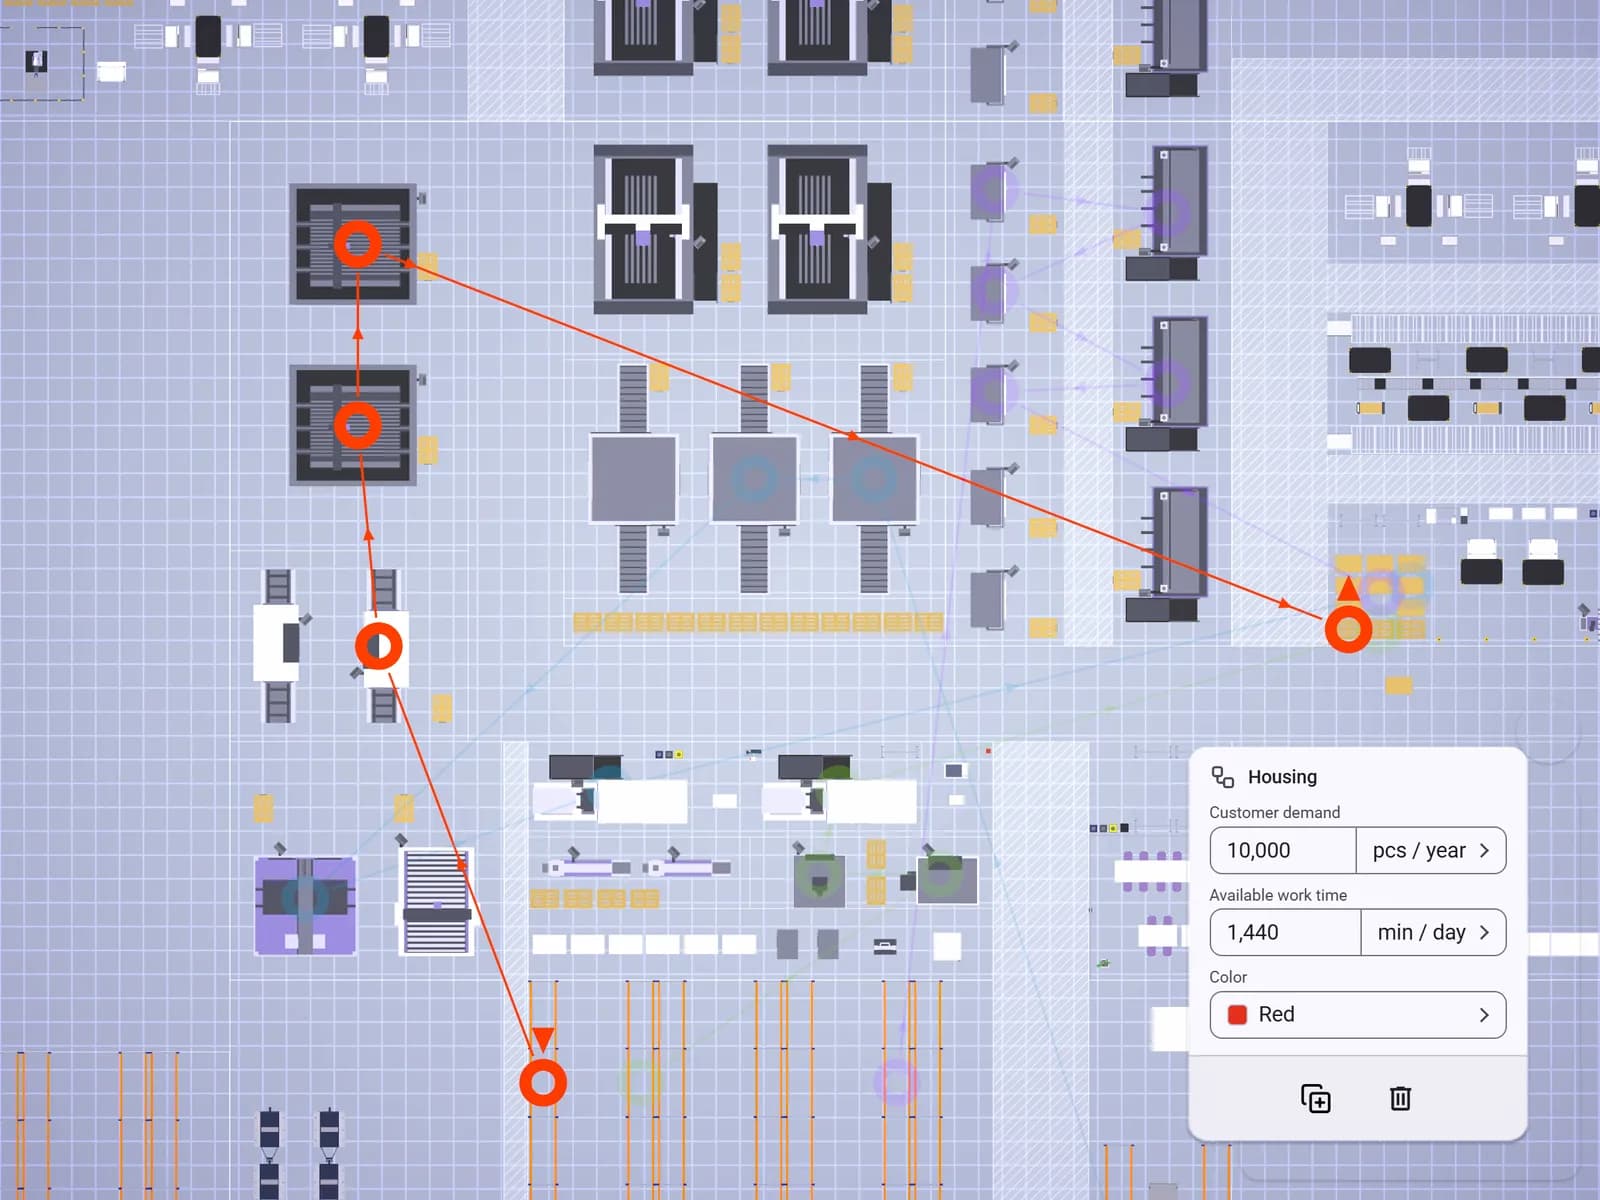
Find where time is lost between the steps. Your layout already knows the steps and distances; Halocline turns it into a value stream map you can share.
Why it matters.
Drawn by hand, out of date fast
Value stream maps on paper or in slides go stale as soon as the layout changes.
Distances are guessed
Transport routes are estimated instead of taken from the real layout.
The bottleneck stays hidden
Without takt and cycle times side by side, nobody sees which step limits the flow.
How you get there.
Create the layout
Draw the hall and place the equipment.
Create the value stream
Name it and lay its steps onto the equipment until the flow is complete.
Enter cycle times and takt
Capture the cycle time per step and the customer demand.
Open and share the map
Open the value stream map and share it as a link.
What you hand over.
A read-only value stream map: process boxes, data boxes, distances, customer and takt, a timeline and key figures. Shared as a link.
Format
- Link
Viewing and sharing as a link are always free. Files come with Team.
Who gets it
The lean team and production management.
The question it answers
Where do we lose time between the steps?
Made from
The value streams you model in the layout.
What's in it.
Process boxes
One box per step, with its cycle time.
Data boxes
The figures of each step, read from the model.
Customer and takt
The demand and the takt the flow has to meet.
Timeline
Process and transport times along the flow, adding up to the lead time.
Key figures
Lead time, takt and bottleneck at a glance.
What is value stream mapping?
Value stream mapping draws the flow of material and information from supplier to customer. Standard symbols show processes, inventory, transport and the timeline of value-adding and waiting time. The map shows where waste sits. In Halocline the map comes from the layout itself instead of a separate drawing.
More about the method →Questions people ask.
- Is there a value stream mapping example or template?
- Halocline does not start from an empty template. The map is built from the value streams in your layout, so steps and distances are already there.
- Does it use the usual value stream mapping symbols?
- The map shows process boxes, data boxes, distances, customer, takt and the timeline as known from value stream mapping.
- What is included in which plan?
- Free maps your own value streams. Team adds transport flow and key figures, Business extended key figures.



Plan the factory. Hand over the results.
Start in the browser, without installation and with no CAD skills required.