Value stream mapping: method, symbols and example
9 min read
Most of the time a part spends in a factory, nobody is working on it. It waits in a box, on a rack, in a buffer. Value stream mapping makes this visible: one page that shows how material and information flow from supplier to customer, and how much of the lead time actually adds value. This article explains the method step by step, the symbols, how to read a value stream map, a worked example and the most common mistakes.
What is value stream mapping?#
Value stream mapping (VSM) is a lean method that draws the flow of material and information for one product family on a single page, from the supplier through every process to the customer. Standard symbols show processes, inventory, transport and information. A timeline at the bottom sets the time in which the product is worked on against the time in which it waits.
The method comes from the Toyota Production System and became widely known through the book “Learning to See” by Mike Rother and John Shook. It has two parts:
- Current-state map: how the value stream runs today.
- Future-state map: how it should run, with flow, pull and fewer inventories. German speakers call this part “Wertstromdesign”.
Value stream mapping vs process mapping#
A process map shows the steps and decisions of one process, often in administration. A value stream map shows the material and the information flow together, with time data and inventories, across the whole factory from the door where material comes in to the door where it leaves.
How to create a value stream map, step by step#
- Choose a product family. Products that pass through similar steps on similar equipment. A matrix of products against process steps helps to group them.
- Set the scope. Usually door to door within one factory. Bigger maps across several factories come later.
- Start with the customer. Draw the customer top right and write the demand in the data box. From the demand and the available working time follows the takt time: available working time ÷ customer demand in the same period.
- Walk the flow on the shopfloor, from shipping upstream. Draw one process box per area with continuous flow and collect its data: cycle time, changeover time, uptime, operators, shifts, batch size.
- Count the inventories. Draw a triangle between the processes and convert the quantity into a range: inventory ÷ daily demand = days of supply.
- Draw supplier and deliveries. Top left the supplier, with the delivery frequency on the truck.
- Draw the information flow. Production control in the top centre; orders, forecasts and schedules as manual or electronic arrows to the processes. Push arrows show where material is pushed.
- Draw the timeline. Below the processes: waiting time from the inventories on the upper level, processing time on the lower level. The sums give the lead time and the processing time.
- Evaluate and design the future state. Mark the improvements with kaizen bursts and draw the future-state map with a plan of how to get there.
Value stream mapping symbols#
The symbols are a common language. You do not need all of them; most current-state maps get by with customer, supplier, process box, data box, inventory, push arrow, information flow and timeline.
| Symbol and look | Means |
|---|---|
| Customer / supplier Factory outline with a sawtooth roof | The outside partners. The customer sits top right, the supplier top left. |
| Process box Rectangle with the name of the process | One area where material flows without stopping, such as pre-assembly or test. |
| Data box Table below the process box | The data of the process: cycle time (C/T), changeover time (C/O), uptime, operators, shifts, batch size. |
| Inventory Triangle with an “I” | Material waiting between two processes. The quantity is written below. |
| Shipment Truck with the delivery frequency | Deliveries from the supplier and to the customer. |
| Push arrow Broad striped arrow | Material is pushed to the next process, whether it needs it or not. |
| Supermarket Shelf open to one side | A controlled stock from which the next process takes what it needs. |
| Withdrawal (pull) Curved arrow out of the supermarket | The next process takes material out of the supermarket. |
| FIFO lane Two lines with “FIFO” | A limited lane between two processes: first in, first out. |
| Kanban Card shapes, kanban post | Signals that release production or withdrawal. |
| Production control Box at the top centre | Planning that receives orders and forecasts and schedules the processes. |
| Manual information Thin straight arrow | Information on paper or by word of mouth, such as a printed schedule. |
| Electronic information Thin zigzag arrow | Information through a system, such as orders from the ERP. |
| Load levelling Box with a grid (heijunka) | Spreads quantity and mix of orders evenly over the time. |
| Go see Glasses | Scheduling by looking at the shopfloor instead of by plan. |
| Operator Person symbol | Number of people in a process. |
| Kaizen burst Starburst | An improvement to make, drawn where it applies. |
| Timeline Square wave below the processes | Upper level: waiting time from inventory. Lower level: processing time. At the end the sums. |
Symbols in PowerPoint or Visio: In PowerPoint you draw the symbols from basic shapes. Visio comes with a stencil for value stream maps. On paper a pencil is enough, because a current-state map changes while you walk the flow.
How to read a value stream map#
- Start at the customer. The takt time is the rhythm everything else is measured against.
- Compare every cycle time with the takt time. A process whose cycle time is above the takt time cannot keep up; that is where the flow is limited.
- Look at the timeline. The share of processing time in the lead time is the flow ratio. In most current-state maps it is small, because the lead time comes from the inventories.
- Look for large inventory triangles. They show where the flow is interrupted, for example in front of a process with long changeovers.
- Follow the information. Many arrows from production control to single processes mean that each process is scheduled on its own, and inventories pile up in between.
Value stream mapping example: assembly of a product family#
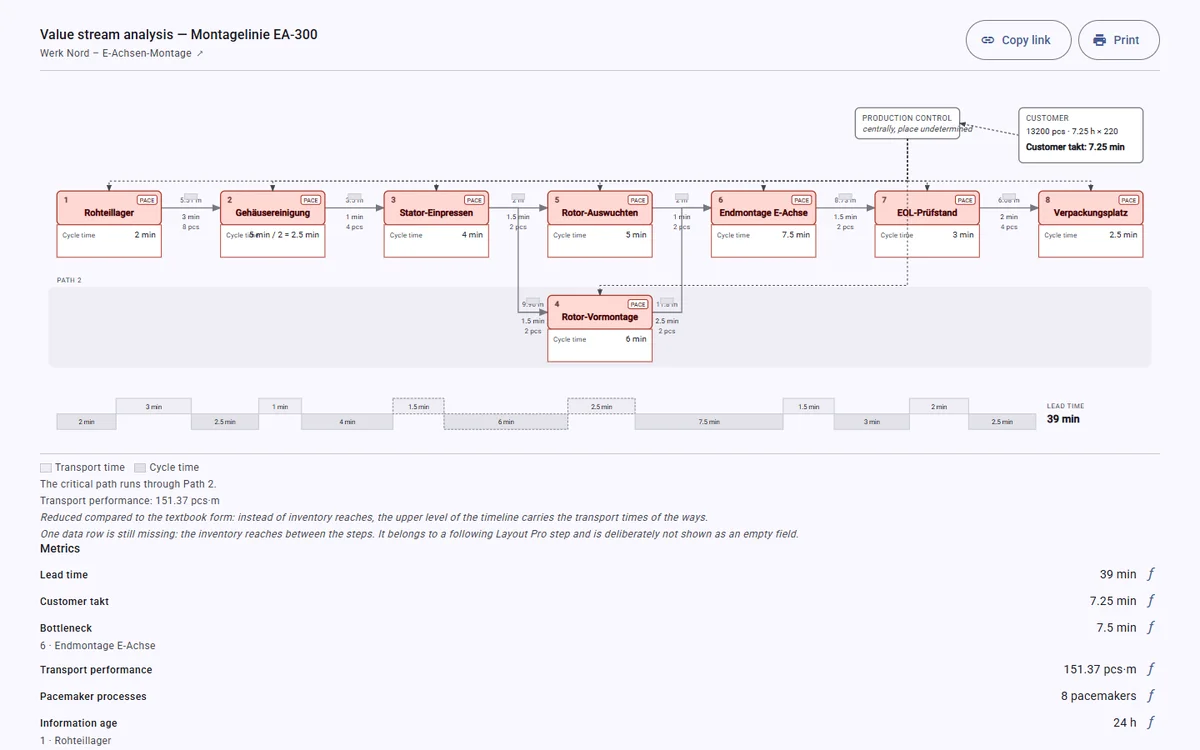
A factory assembles a product family in three steps: pre-assembly, final assembly, test and packing. Purchased parts come by truck from one supplier.
Current state. Walking upstream from shipping, the team finds finished goods in front of shipping, a buffer between test and final assembly and a stock of pre-assembled parts in front of final assembly. Production control sends a schedule to each of the three processes; push arrows connect all of them. Converted into days of supply, the inventories make up almost all of the lead time on the timeline: if as many parts wait in front of final assembly as the customer takes in two days, every part waits there about two days. The processing time is a short line at the bottom. Final assembly has the longest cycle time, close to the takt time.
Future state. Pre-assembly and final assembly become one flow line paced by the takt time. A FIFO lane with a limited quantity connects it to test. Purchased parts go into a supermarket from which the line takes what it needs. Production control schedules only the line, the pacemaker process; everything upstream is pulled. Kaizen bursts mark the changes: shorter changeovers in pre-assembly, the FIFO lane, the supermarket.
Which lead time the future state reaches is measured when the next current-state map is drawn, not assumed in advance.
Value stream mapping template#
A paid template is not needed. A large sheet (A3 or bigger) with these areas is enough:
- top left the supplier, top right the customer with demand and takt time, top centre production control;
- in the middle a row of process boxes with data boxes, inventory triangles in between;
- at the bottom the timeline with lead time and processing time;
- a header with product family, date, team and scope.
For the data, a table with one row per process (cycle time, changeover time, uptime, operators, shifts, inventory before the process) helps. In Excel you can calculate takt time and days of supply in it.
Value stream mapping in logistics and beyond#
In logistics, transports between the processes get their own process boxes, with distance and means of transport. A spaghetti diagram then shows the routes within one area in detail. Value stream mapping also works outside of production, for example in administration or in software development, where the “material” is an order, a document or a change.
Approaches called “value stream mapping 4.0” extend the information flow: they show where data are captured, stored and used, and where information is lost between systems.
Common mistakes#
- Mapping from the office. Data from the ERP show how the process should run. Walk the flow and count.
- No product family. Everything on one map makes it unreadable. One family per map.
- Starting at incoming goods. Start at the customer: the takt time sets the measure for everything else.
- Averages only. An average cycle time hides changeovers and disruptions. Note the range as well.
- Forgetting the information flow. Without it the map shows where material waits, but not why.
- Too much detail. A process box per area with continuous flow, not per manual step.
- Stopping at the current state. The value is in the future-state map and the plan to reach it.
- Drawing it once. A map that is not updated after the next layout change is out of date.
Frequently asked questions#
What does VSM stand for?
Value stream mapping. The drawing is called a value stream map.
What is value stream mapping called in German?
Wertstromanalyse for the current state and Wertstromdesign for the future state. The overall method is also called Wertstrommethode.
Who creates a value stream map?
A small team from production, logistics, planning and quality, led by someone responsible for the whole value stream. People from the shopfloor belong in it, because they know where material waits.
Which software can I use for value stream mapping?
Paper and pencil for the first map, then drawing tools such as Visio or PowerPoint, or software that builds the map from a layout. What matters is that the map stays up to date when the layout changes.
Is value stream mapping only for production?
No. The method works wherever work flows through several steps: in logistics, administration and software development.
Value stream mapping from your layout#
In Halocline the value stream map comes from the layout itself: you model the value streams on the equipment in the layout, and steps and distances are already there. The map shows process boxes, data boxes, distances, customer, takt time and timeline and is shared as a link. The feature is in development. See how value stream mapping works in Halocline →