Spaghetti diagram: method, example and template
7 min read
Walking is the waste nobody sees. A worker who fetches a part, looks for a tool or carries a finished unit to a rack is busy all day, and yet none of these trips adds value. A spaghetti diagram puts these paths on paper. This article explains what a spaghetti diagram is, how to create one step by step, how to read it and which mistakes to avoid.
What is a spaghetti diagram?#
A spaghetti diagram (also called spaghetti chart or spaghetti plot) traces the actual path of a person, a part or a document through a process as one continuous line on a floor plan. After a few cycles the lines pile up like a plate of spaghetti, which gives the method its name.
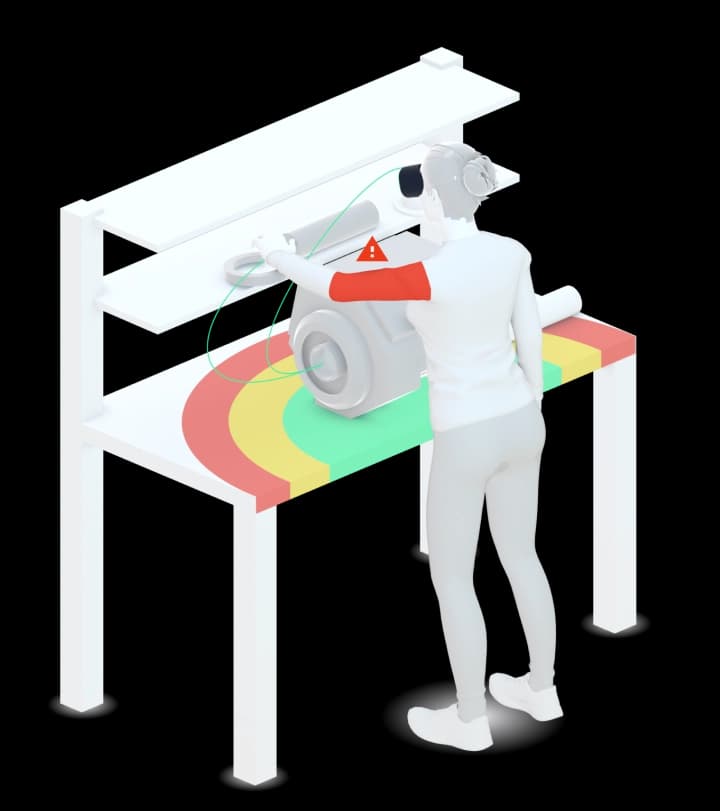
It is a classic lean tool. It makes two of the seven types of waste (muda) visible: motion, the walking and reaching of people, and transport, the moving of material. Lean and Six Sigma teams use it in the analysis phase of an improvement project, before they rearrange a workstation or a work area.
What is a spaghetti diagram used for?#
- Show how far people really walk in a process, not how far the work plan says they walk.
- Find detours, backtracking and trips that come up again and again.
- Find places where paths cross: congestion, waiting and safety risks.
- Give a layout change a baseline, and show the effect afterwards with the same diagram (before and after).
How to create a spaghetti diagram, step by step#
- Define the scope. One process, one object to follow (a person, a part or a document), a clear start and end. Example: one assembly cycle, from taking the base part to putting the finished unit on the outgoing rack.
- Get a floor plan to scale. Workstation, shelves, carts, machines, doors and aisles. A printout of the layout or a sketch with a scale bar is enough; without a scale you cannot measure distances later.
- Observe on the shopfloor. Draw what happens, not what should happen. Walk along, and tell the team beforehand why you are there: the diagram is about the process, not about the person.
- Draw every movement as a line without lifting the pen. Mark each stop with a dot and a number, and note what happens there: fetch, search, wait, put down.
- Observe several cycles. Rare trips, such as fetching a new box of screws or asking for a tool, only show up over a longer time. Use one colour per person, part or cycle.
- Measure. Count the trips per connection and add up the line lengths with the scale. If you can, note the time as well.
- Analyse with the team and redraw. Agree on measures, change the layout and draw the diagram again in the same way. Only the comparison shows what the change brought.
How to read a spaghetti diagram#
The diagram does not need a legend to make its point, but it pays to read it systematically:
- Dense bundles between two points mean frequent trips. The two points belong closer together, or the material should come to the person.
- Long single lines across the area point to a shared resource far away: a tool, a printer, a measuring station.
- Back and forth on the same route shows that work is done in small portions or that something is missing at the point of use.
- Crossing lines mark places where people or vehicles get in each other's way.
- Lines leaving the work area show dependencies on other areas that the workstation alone cannot solve.
For each bundle, ask: why does the path go there? Could the part, the tool or the information come to the person instead?
Spaghetti diagram example: an assembly workstation#
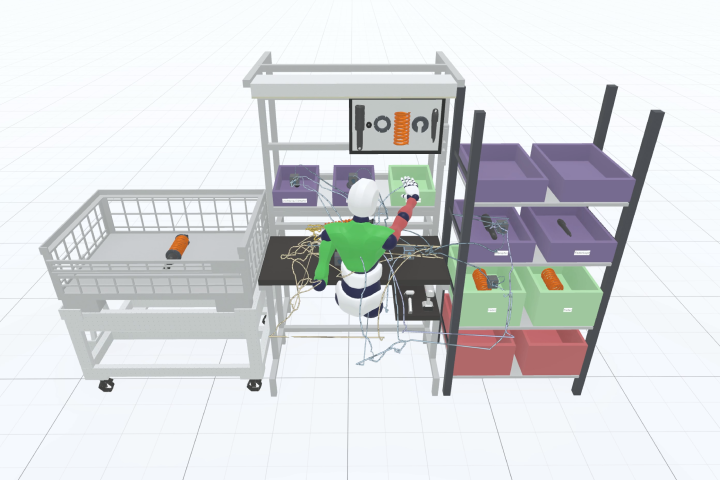
Before. A worker assembles a unit at a bench. The parts lie on a shelf at the wall, the screws in a box on a cart, the torque tool hangs at the neighbouring station, and the finished unit goes to a rack next to the aisle. The spaghetti diagram shows three things:
- the thickest bundle runs between bench and shelf, because the parts are fetched for each unit;
- a long line leads to the neighbouring station for the tool and crosses the path of the colleague working there;
- a loop leads to the rack and back, against the direction of flow.
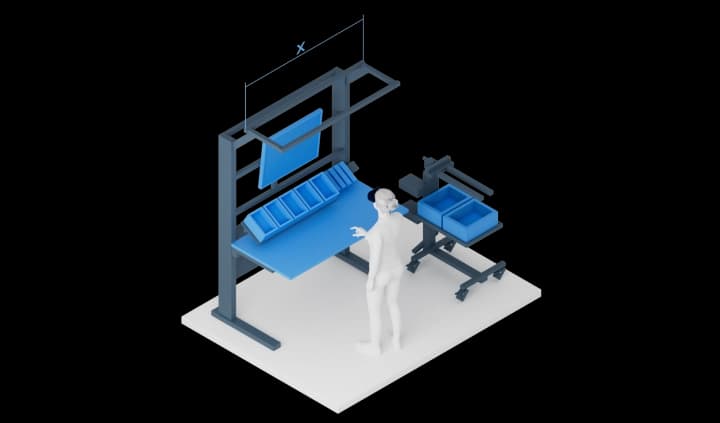
Measures. Parts in grip containers at the bench (point of use), an own torque tool on a balancer above the bench, the outgoing rack on the outfeed side in the direction of flow.
After. The redrawn diagram shows short lines around the bench and no crossing paths. How much walking was saved is what you measure in the second diagram, not what you estimate in advance.
Spaghetti diagram template#
You do not need a special template. What you need:
- a floor plan of the area to scale, with a scale bar;
- pens in several colours and a clipboard;
- a header with process, date, observer, object followed, number of cycles, start and end;
- a tally table: from, to, number of trips, distance, reason.
Spaghetti diagram in Excel: you can place a floor plan as a picture and draw lines on it, but every change means drawing again. Excel is better suited to the tally table and the sum of the distances. Software that draws the paths from a recorded process saves the drawing altogether.
Common mistakes#
- Drawing from memory or from the work plan instead of observing. The diagram then shows the planned process, not the real one.
- Too short an observation. One cycle misses the rare trips, which are often the longest.
- Mixing objects. Person and part in one line make the diagram unreadable. Follow one object per diagram or per colour.
- No scale. Without it you can show the paths, but not measure them.
- Blaming the person. Long paths come from the layout and the material supply, not from the worker. Said wrongly, the next observation will not show the real process.
- Stopping at the diagram. Without measures and a second diagram afterwards, the effort is wasted.
Spaghetti diagram and other lean tools#
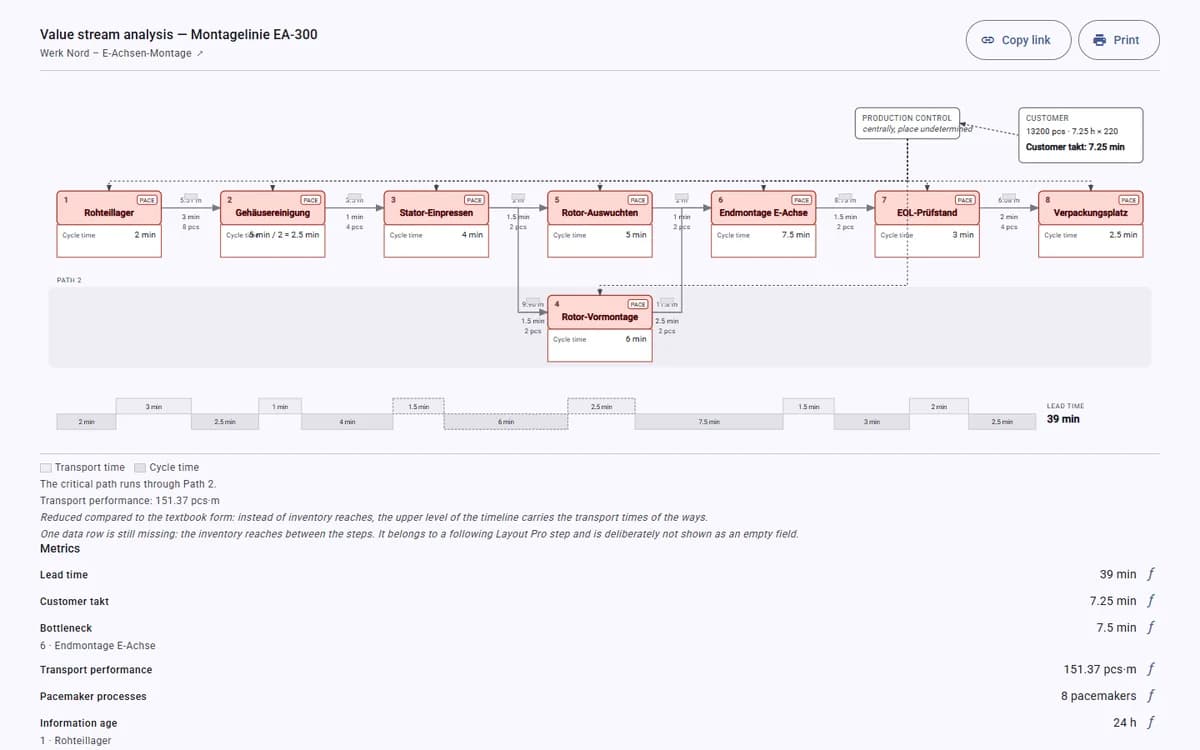
The spaghetti diagram looks at one work area in detail. Value stream mapping looks at the whole flow from supplier to customer and shows where in that flow time is lost. Both work well together: the value stream map shows which area to look at, the spaghetti diagram shows what happens there. To add times to the paths, see time and motion analysis at the workstation.
Frequently asked questions#
What is a spaghetti diagram in lean?
A lean tool that shows the paths of people or material in a process as lines on a floor plan. It makes waste from motion and transport visible and gives a layout change a baseline.
What is the difference between a spaghetti diagram and a spaghetti chart?
In lean they mean the same. Outside of lean, “spaghetti chart” also refers to other plots with many crossing lines, for example forecast tracks in weather reports.
Can I use a spaghetti diagram in logistics?
Yes. In logistics it shows the routes of forklifts, tugger trains or pickers through a warehouse or a hall. The method stays the same; the object you follow is a vehicle or an order instead of a worker.
How many cycles should I observe?
Enough to see the normal process including the rare trips. For tasks that do not happen in every cycle, observe over a longer time, such as part of a shift.
What is a spaghetti diagram called in German?
Spaghetti-Diagramm. The method and the drawing are the same.
Spaghetti diagram without drawing by hand#
In Halocline you record a process once, and Halocline draws every walking path into a spaghetti diagram over the layout of the workstation. It comes in the process report as an XLSX file, so you compare before and after without drawing again. See how the spaghetti diagram works in Halocline →