Load assessment using the key indicator method (KIM)
3 min read
- Professional
- Desktop
Function#
DThe visualization "Analysis" shows you in Halocline Performance, based on the Key Indicator Method, which areas of your station are ergonomically problematic. The evaluation of the object location is done via the parameters weight, distance, lift distance and duration.
Instruction#
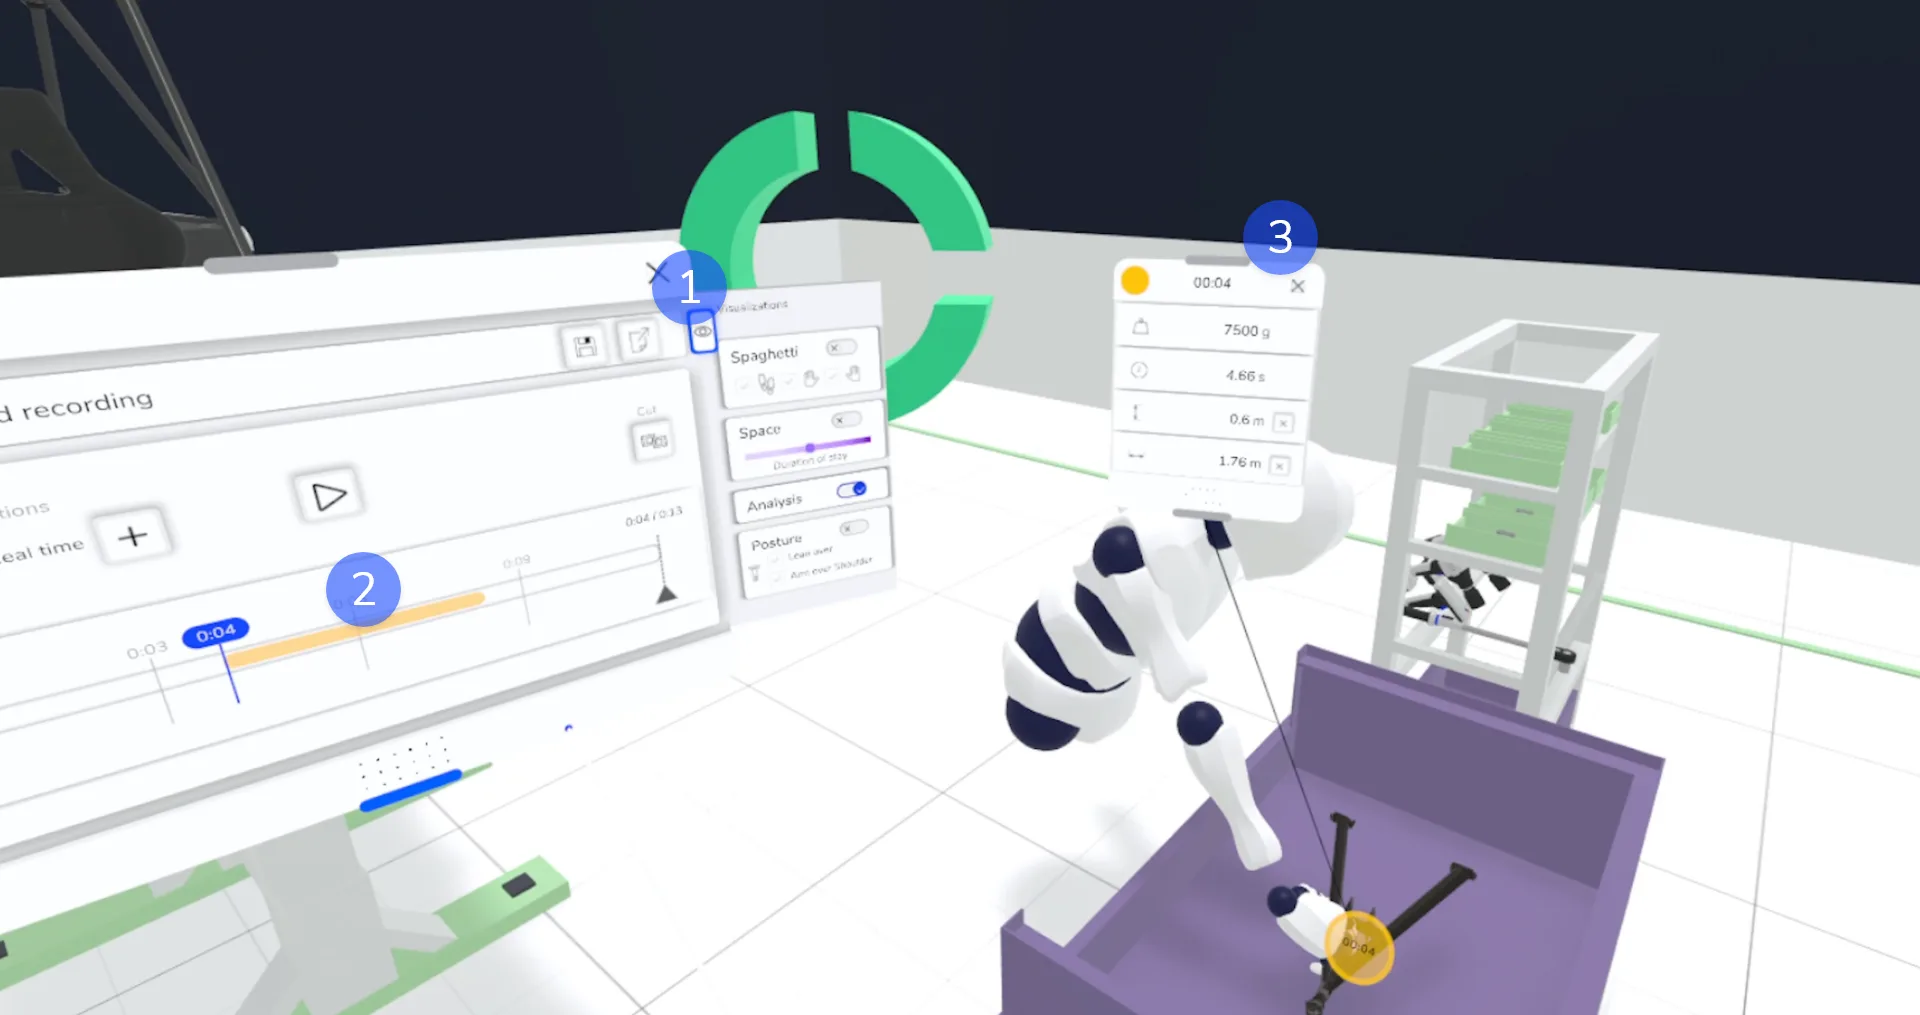
Menu > Evaluation > Replay > Visualizations > Analysis
(1) Enable visualization#
Note: You should first assign a weight to all relevant objects before starting the recording. The analysis visualization only works for objects with assigned weight. |
To use this function, select a calibrated recording or create a new exposure with a calibrated body.
In the replay window, click on the "Visualization" button on the right edge and activate the "Analysis" function there.
(2) Time visualization#
On the timeline of the replay window you can now see the time periods of ergonomically problematic classified object movements by color-coded areas.
- Yellow areas: Potentially unergonomic object movements.
- Red areas: Critical unergonomic object movements
|
Note: Object movements classified as unproblematic are not shown for better clarity. However, the underlying data (weight, distance, time) are included in the tabular export (see Tabular Report | Using Data from Halocline Performance). Hinweis: Als unproblematisch eingestufte Objektbewegungen werden zwecks besserer Übersichtlichkeit nicht dargestellt. Die zu Grunde liegenden Daten (Gewicht, Distanz, Zeit) sind aber im tabellarischen Export enthalten (siehe Tabellarischer Report | Nutzung der Daten aus Halocline Performance) |
(3) Spatial visualization#
The evaluation of the individual object movements is additionally indicated by markers in the room. Here, a yellow or red dot marks the starting point of the evaluated object movement. The temporal visualization in the replay window and the spatial visualization of the markers are linked. With a click on the marker you can display the corresponding parameters as values as well as visualizations.
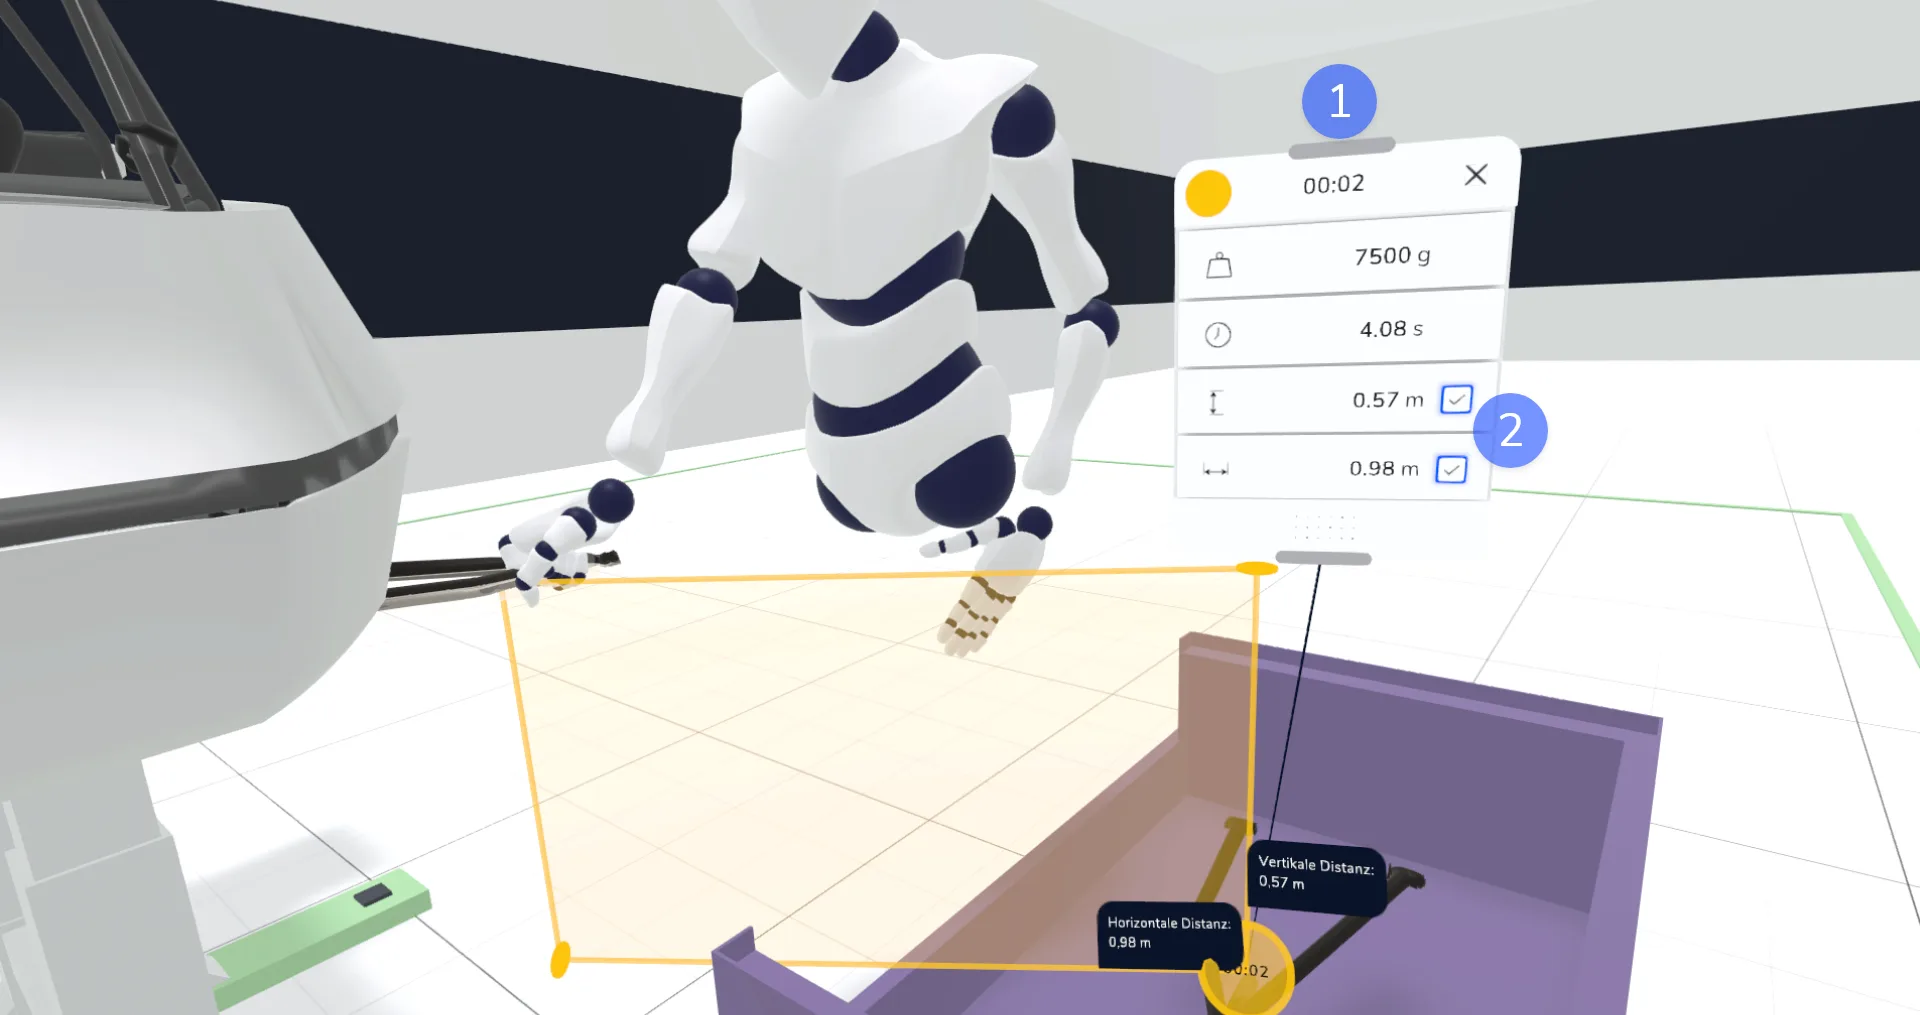
(1) Marker: Parameter window.
In the parameter window all values of the object movement are displayed, which were considered in the evaluation:
- The weight of the moved object
- The duration of the movement
- The vertical distance (direct, vertical distance between the start and end points of the movement)
- The horizontal distance (direct, horizontal distance between the start and end points of the movement)
(2) Marker: Visualization of the distances
- If you want to follow the measurement points of the distances more precisely, you can click on the box next to the values of the vertical and horizontal distance and thus activate the visualization.
Navigation of the visualization#
Click on a color-coded area in the timeline or on a marker in space to jump to the starting point of the evaluated object movement and display the parameters.
How it works#
In the analysis method, the performer's body-based movement (e.g. knee bend vs. forward bend) is left out. The object-based parameters are independent of the performer's movement type and focus on the object's movement type. In this way, the current station and location can be evaluated rather than individual movements. The parameters that are measured for evaluation are:
- The weight of the object
- The position of the gripping action
- The position of the place / release action
- The time
The variables that are calculated from this and used for the analysis are:
- The weight
- The stroke distance (vertical distance)
- The distance (horizontal distance)
- The duration
The evaluation is carried out from the moment of grasping to the moment of release and is based on the division into categories, following the Key Indicator Method.
- Weight categories (e.g. 3-5kg, 5-10kg,..)
- Position categories (e.g. above the shoulder, below the shoulder, above the elbow,...)
- Duration and distance categories (e.g. >5sec or >2m, ...)
The weightings of the individual categories are then summed up and added to a total score. Based on this total evaluation, the classification into the analysis categories yellow and red is made.