Scenario comparison for your layout.
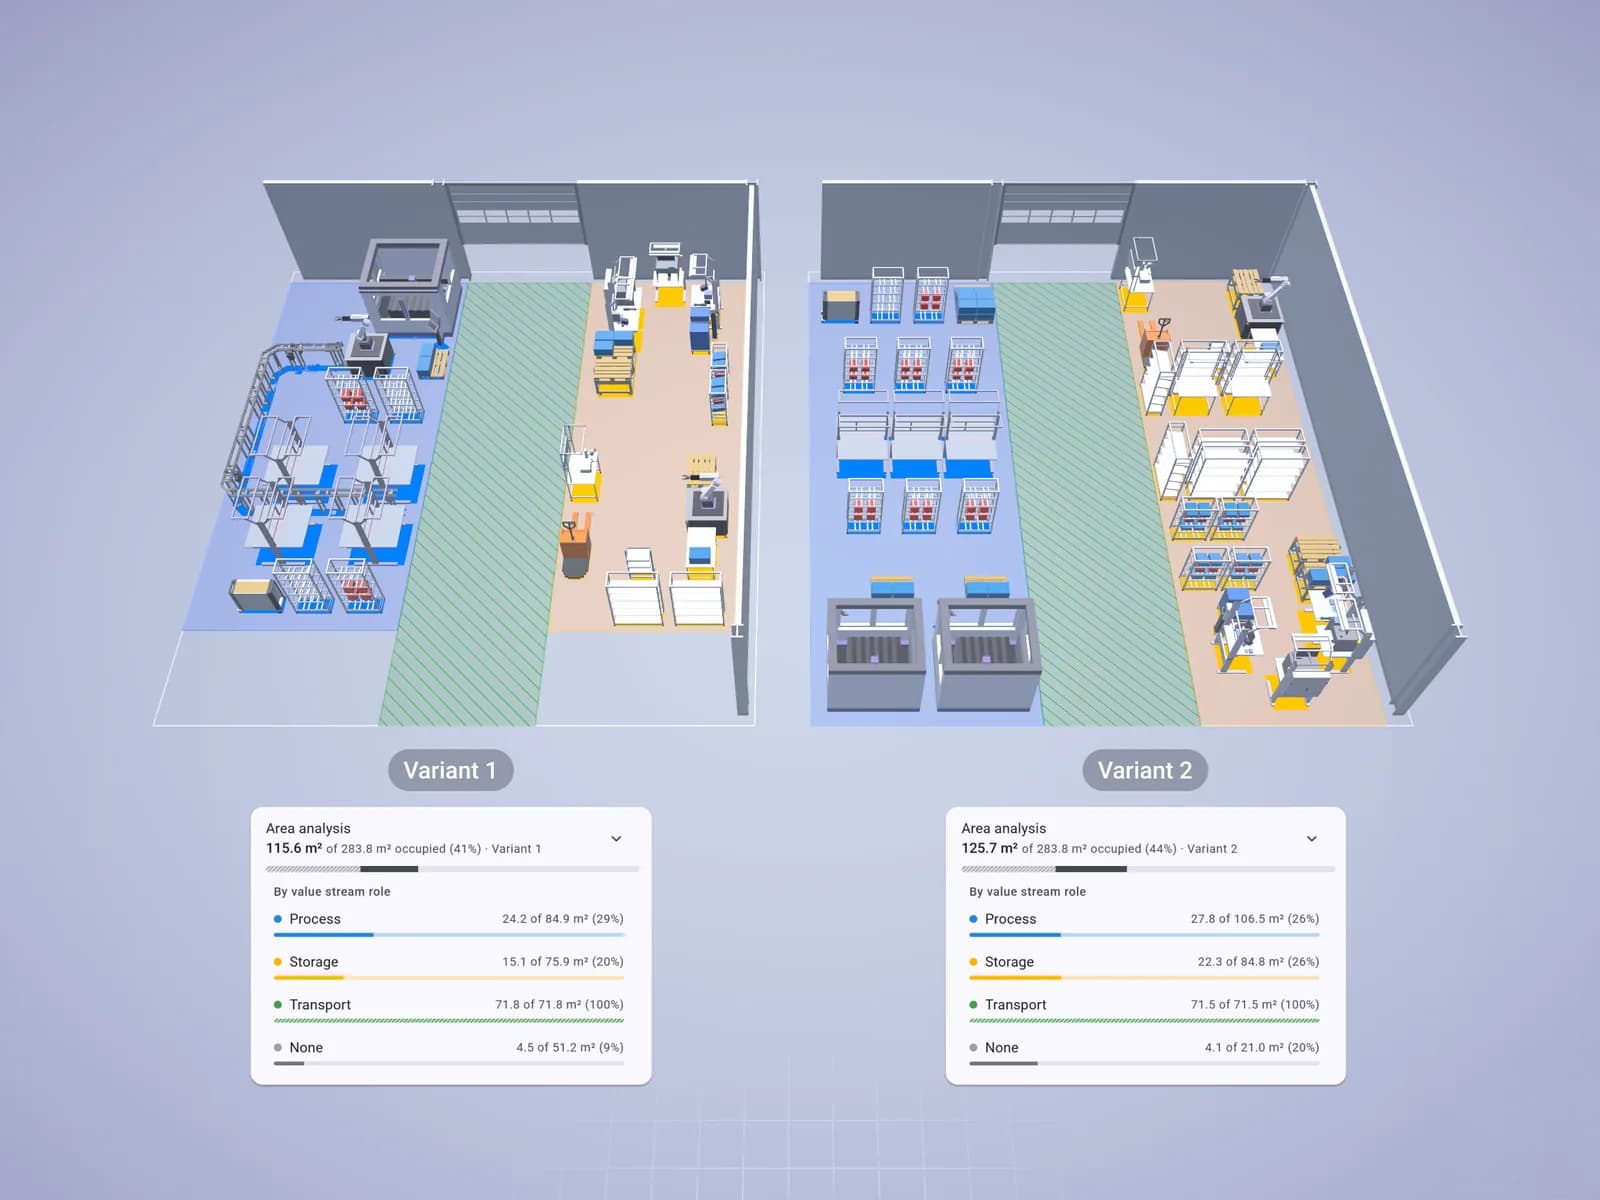
Decide between layouts with figures, not opinions. Put several scenarios next to each other, with the current state as reference, and see which is better and where.
In development: this result comes with an update.
Why it matters.
Comparisons by gut feeling
Two layouts look similar; which one is better stays a matter of opinion.
Figures come from spreadsheets
Key figures are copied by hand and no longer match the layout.
It is unclear where the difference is
A total says one scenario wins, but not in which figure.
How it will work.
Create a layout worth comparing
Start from the current state of your layout.
Create a second scenario
Copy it and replan: reshape areas, move or remove resources.
Open the comparison
See the key figures of both states side by side.
Share the comparison
Hand it on as a link.
What you hand over.
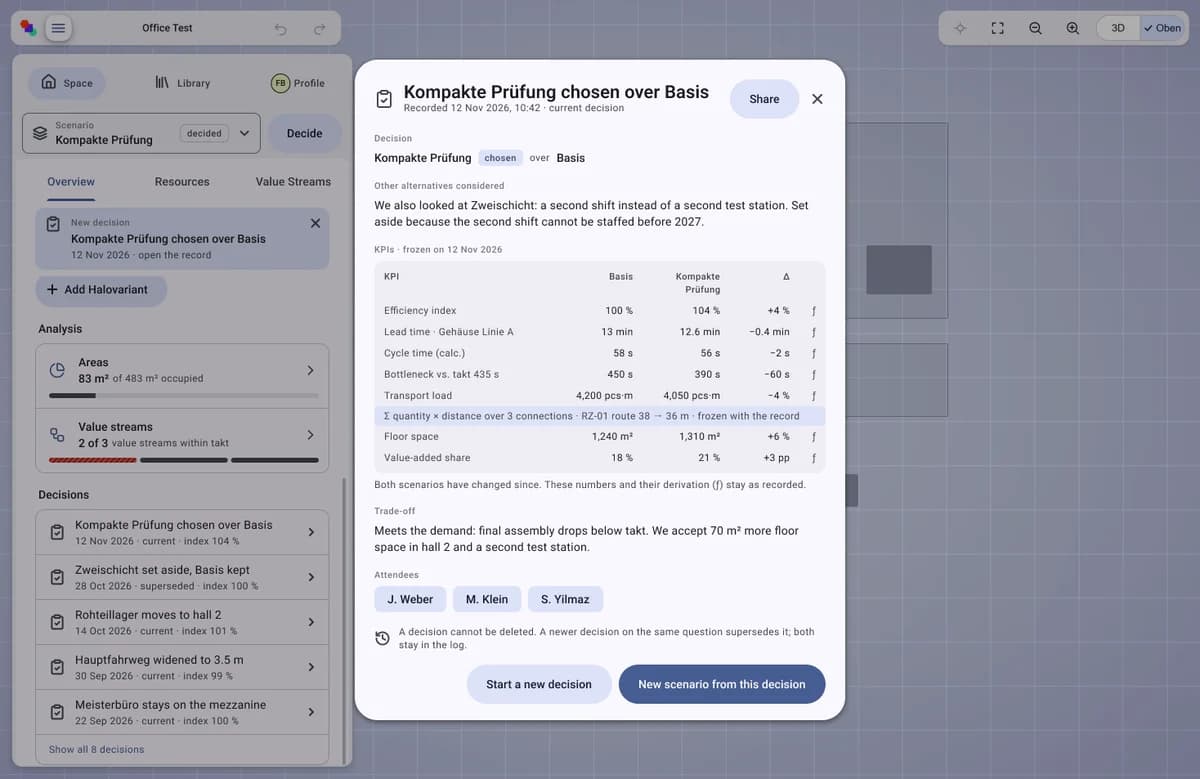
All key figures of several scenarios side by side, with the current state as reference and the derivation of each row.
Format
- Link
Viewing and sharing as a link are always free. Files come with Team.
Who gets it
Planners and management.
The question it answers
Which scenario is better, and where exactly?
Made from
The scenarios of a layout project.
What's in it.
Reference column
The current state every other scenario is measured against.
Key figures per row
Efficiency index, floor area, transport and lead time.
Difference per figure
How much and in which direction each scenario differs.
Derivation
How each value comes about, row by row.
What is a scenario comparison?
A scenario comparison sets alternative plans against the same criteria, such as area, distances or transport effort. A reference, usually the current state, makes the differences visible. It turns opinions into a comparable table. In Halocline the figures come from the scenarios in the layout.
More about the method →Questions people ask.
- Is there a scenario comparison table or template?
- The table is built from your scenarios. Each row shows how the figure is derived.
- What can I compare in Free and Team?
- Free compares two scenarios as a pair with an efficiency index, Team as a pair with all basic key figures. Business compares several scenarios.
- Is the scenario comparison available today?
- It is in development.
What customers get out of it.



Plan the factory. Hand over the results.
Start in the browser, without installation and with no CAD skills required.